Benchmarks and vendor claims checked October 2026.
TL;DR
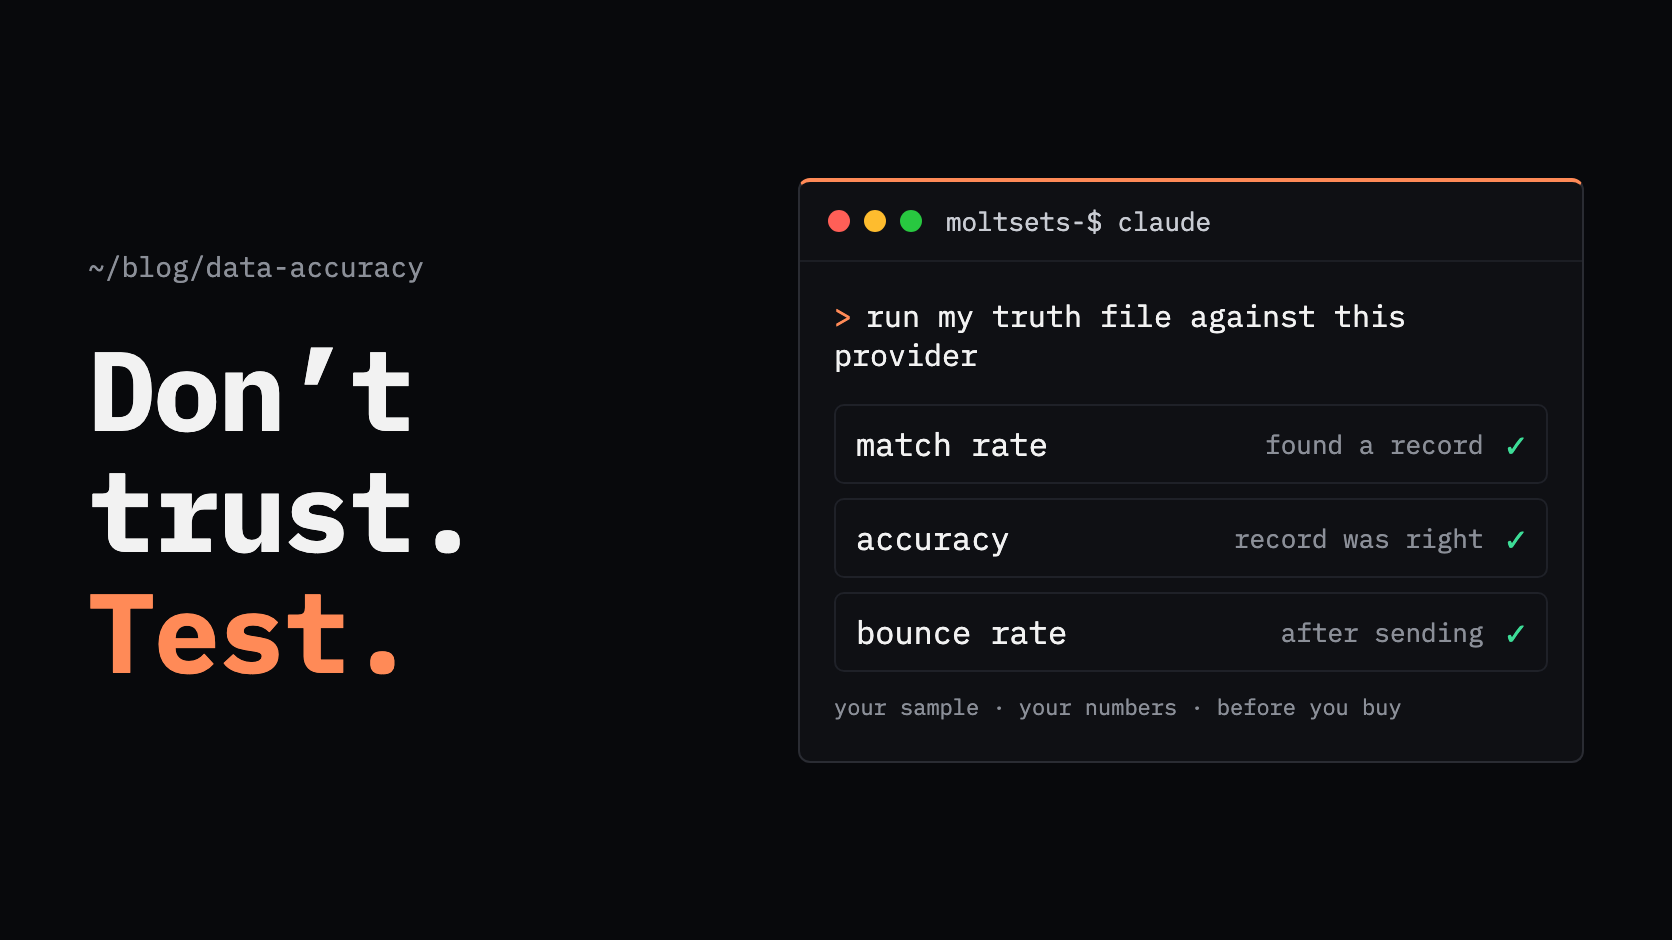
You can't verify a vendor's advertised accuracy number, so measure accuracy yourself: run a sample of contacts you already know are correct through the provider and compare. Track three numbers separately: match rate (how often you get a result), accuracy (how often the result is right), and bounce rate (how often emails fail when you send). Quick version:
If you're comparing providers before you buy, run the same known-good sample of about 400 contacts through each and measure match rate and accuracy.
If you care most about deliverability, measure hard bounce rate on real sends, broken out by the provider's verification status.
If you care most about coverage, measure match rate, but only alongside accuracy.
If you're testing phone data, measure connect rate to the intended person, not just whether a number came back.
Every provider's numbers vary by region, industry, and seniority. The only accuracy figure that matters is the one you measure on your own data.
How do I measure contact data accuracy?
To measure contact data accuracy, take a sample of contacts whose details you already know are correct, remove the emails or phone numbers, run the sample through the provider, and count how many returned values match the truth. Then send to a portion of the results and track the real bounce rate.
That gives you three numbers, each answering a different question:
Match rate: how often does the provider return anything?
Accuracy: when it returns something, how often is it right?
Bounce rate: when you send to it, how often does it fail?
A provider can look strong on one and weak on another, so measure all three.
What's the difference between match rate, accuracy, and deliverability?
Match rate is how often a provider returns a result, accuracy is how often that result is correct, and deliverability is how often an email actually reaches an inbox. Treating them as the same number is the most common mistake in evaluating contact data.
Metric | Question it answers | Formula |
|---|---|---|
Match rate | How often do I get a result? | Records with a result ÷ records submitted |
Accuracy | How often is the result right? | Correct results ÷ results returned |
Effective yield | How many correct contacts do I get per record? | Match rate × accuracy |
Hard bounce rate | How often does sending fail permanently? | Hard bounces ÷ emails sent |
Connect rate (phones) | How often does a dial reach the right person? | Conversations with the intended person ÷ dials |
Why the distinction matters, with a worked example. Two providers each get 100 records:
Provider A matches 90 and 80% of those are correct: 72 correct contacts and 18 wrong ones.
Provider B matches 75 and 96% of those are correct: 72 correct contacts and 3 wrong ones.
Both have the same effective yield, but Provider A gets there with more wrong contacts: 18 against 3. That’s why you need match rate, accuracy, and effective yield side by side. Together, they show which provider gives you the most correct contacts with the fewest wrong ones.
Deliverability is a third, separate thing. A deliverable email can still belong to the wrong person, for example, someone leaves a company and their old address now forwards to a colleague. The email still delivers, but it no longer reaches the person you wanted. Catch-all domains cause the same problem.
Why can't you trust advertised accuracy numbers?
You can't rely on advertised accuracy numbers because vendors rarely publish how they measured them: on which records, over what period, and which results were excluded. A figure like "98% accurate" may be correct for what the vendor measured and still not predict what you'll see on your list.
Some public examples, quoted from each vendor's own site:
Vendor | Public claim | What the page defines |
|---|---|---|
"Up to 95% accuracy" on first-party data | No method or sample stated | |
Lusha | 98% email accuracy, 85% US phone accuracy | Records "checked across multiple independent sources"; no sample or definition |
ZeroBounce | 99.6% email validation accuracy, guaranteed | Applies to "standard list validation"; its own hard-list test measured 98.0% |
Findymail | Bounce rate under 5%, or credits refunded | Measurement window and treatment of catch-alls not stated |
These aren't necessarily wrong. They're just not defined in a way you can reproduce. Common ways accuracy figures end up higher than what a buyer sees:
Counting only matched records. Accuracy measured on results returned says nothing about records that came back empty.
Excluding catch-alls and unknowns. Guarantees often cover only addresses the tool labels "valid," which leaves out the hardest cases.
Testing on easy data. Accuracy on large US companies with standard email formats is higher than on small companies, international contacts, or frequent job-changers.
Mixing fill rate with accuracy. A "hit rate" measures how often a field is filled, not whether the value is correct.
This isn't unique to any one vendor; it's how accuracy marketing works across the category. The fix is the same for every provider: test it yourself.
How do I run my own accuracy test?
To run your own accuracy test, build a sample of contacts you know are correct, hide the answers, run the sample through each provider, and score the results with the formulas below. It takes a few hours and costs little or nothing on most free tiers.
Build a known-good sample. Use contacts whose email you've confirmed recently, such as customers, people who replied to you in the last 90 days, or recent meeting attendees. Record the true email, phone (if testing phones), title, and company for each.
Match the sample to your real targets. Include the same mix of company sizes, industries, countries, and seniority you actually sell to. A sample of only big US companies will flatter every provider.
Pick a sample size. About 400 contacts gives you a result within roughly ±5 percentage points at 95% confidence (see the sample-size FAQ below). Use the same sample for every provider.
Hide the answers. Send each provider only the inputs you'd have in real life, such as a LinkedIn URL or a name and company domain, never the email you're testing for.
Record every result with its status. Keep the returned email or phone and the provider's verification status (valid, catch-all, unknown, or a risk grade) for each record.
Score match rate and accuracy. Count matches, then compare each returned value to your truth file. Score accuracy separately for each verification status.
Measure real bounces. For new prospects you'll actually email, send to a small batch and track hard bounces by verification status. Accuracy tells you whether the data is right; bounce rate tells you whether it's safe to send.
Repeat every quarter. Data and providers change, so rerun the test before renewals.
A scoring sheet for one provider might look like this:
Status returned | Results | Correct | Accuracy |
|---|---|---|---|
Valid / deliverable | 260 | 247 | 95% |
Catch-all | 60 | 45 | 75% |
Unknown | 20 | 11 | 55% |
No result | 60 | – | – |
Total | 400 submitted, 340 matched | 303 | 89% |
Here the match rate is 85% (340 ÷ 400), overall accuracy is 89% (303 ÷ 340), and effective yield is 76% (303 ÷ 400). The breakdown shows where the errors sit: mostly in catch-all and unknown results. These numbers are illustrative, not a benchmark.
How do I run an accuracy test in Claude or ChatGPT?
To run an accuracy test in Claude or ChatGPT, connect the provider you're testing, share your sample with the answers removed, and ask Claude to look up each record and score the results against your truth file.
Connect the provider. MoltSets, for example, connects to Claude (claude.ai, Claude Desktop, or Claude Code) on every Claude plan and to ChatGPT on Business, Enterprise, and Edu plans.
Ask for the test. For example: "Look up an email for each LinkedIn URL in sample.csv. Then compare to truth.csv and give me match rate, accuracy, and accuracy by risk grade."
Review the scored table in the chat, and spot-check a few rows by hand.
There's no separate dashboard to log into, and Claude does the scoring arithmetic for you.
What are the metrics that matter, and what are realistic benchmarks?
The metrics that matter are hard bounce rate, match rate, accuracy, and, for phones, connect rate. Only bounce rate has widely published thresholds; the others depend so much on your list that you should set your own baseline from your first test.
Hard bounce rate. Email platforms publish the thresholds at which they step in:
Platform | What it says |
|---|---|
Amazon SES | Keep bounce rate below 2%; at 5% the account goes under review, and at 10% sending may be paused |
HubSpot | A 5% hard bounce rate can lead to marketing email suspension |
Twilio SendGrid | Keep hard bounces under 5% of attempted messages |
Postmark | Terms of service require a bounce rate under 10% |
A practical target: keep hard bounces under 2%, and treat anything near 5% as a problem to fix before your next send.
Match rate. There's no meaningful industry benchmark, because match rate depends on your list. Expect higher rates on work emails at mid-size and large companies, and lower rates on small businesses, personal emails, and mobile numbers.
Accuracy. Measure it on your own sample, by verification status. Watch the gap between "valid" results and catch-all or unknown results more than the overall average.
Connect rate (phones). Definitions vary: some tools divide conversations by dials, others by calls connected or calls a rep logged, and "connect" may mean any person or the intended prospect. Pick one definition and use it for every provider. Dialer vendors publish their own benchmarks; Orum, for example, puts typical connect rates at 3% to 10%.
What does good data transparency look like?
Good data transparency means a provider tells you how confident it is in each record, charges you only when it returns something, and verifies data at the source rather than relying on old database matches. These features don't prove accuracy, but they make it far easier to measure.
What to look for:
A confidence or risk signal on every record, not just valid or invalid. A grade lets you send to the safest results and hold back the rest.
A clear definition of that signal. You should know whether it measures deliverability, identity match, or both.
A validation date. You should know when each email or phone was last checked.
No charge for misses, so testing a hard sample doesn't cost you for empty results.
Source verification, such as a live check at lookup time, or a carrier check for mobiles.
MoltSets is one example. Every email it returns carries an A–F risk score and a last-validated date. MoltSets' documentation is explicit that the grade measures how safe an address is to send to, not whether it belongs to the person you looked up, and it recommends tracking your own bounce rate by grade. Mobiles are carrier-verified within the last 90 days, and misses use no records. Paid plans start at $27/mo with no per-lookup credits, and the free plan's 1,000 lifetime records are enough to run the test above.
MoltSets doesn't prove its own accuracy any more than other vendors do. Test it on your data like any other provider.
Which metric should you optimize for?
Optimize for accuracy and bounce rate if you send email at volume, and for match rate only when coverage is the bottleneck and you can verify results before use.
Your situation | Optimize for |
|---|---|
Cold email at volume, protecting a sending domain | Hard bounce rate and accuracy of "valid" results |
Account-based outreach to a small, named list | Match rate, then manual review |
Phone-heavy outbound | Connect rate to the intended person |
Enriching a CRM for routing and reporting | Accuracy of titles and companies |
Comparing providers before a contract | Effective yield (match rate × accuracy) on the same sample |
Frequently asked questions
Aim for a hard bounce rate under 2%. Email platforms step in around 5%: Amazon SES puts accounts under review at 5%, HubSpot can suspend marketing email at a 5% hard bounce rate, and SendGrid recommends staying under 5%.
Match rate is the share of records for which a provider returns any result. Accuracy is the share of those results that are correct. A provider with a 90% match rate and 80% accuracy gives you more wrong contacts than one with a 75% match rate and 96% accuracy.
About 400 records gives a result within roughly ±5 percentage points at 95% confidence, and about 1,070 gets you to ±3 points. The formula is n = z² × p(1 − p) ÷ e², where z is 1.96 for 95% confidence, p is 0.5 for the most conservative estimate, and e is the margin of error.
It varies too much to give one number. Accuracy depends on the provider, the region, company size, seniority, and how recently the data was verified. Vendor claims typically range from about 85% to 99%, but few define how they were measured, so test on your own sample.
Run the same known-good sample of about 400 contacts through each provider using a free tier or trial, with the answers removed. Score match rate, accuracy by verification status, and effective yield, then send to a small batch and measure hard bounces.
Run a sample of contacts you know are correct through the provider with the answers hidden, then compare what comes back. Measure match rate, accuracy, and real bounce rate separately, and break accuracy out by the provider's verification status.
Yes, once the provider is connected. With MoltSets connected through MCP, Claude can run your sample, compare the results to your truth file, and calculate match rate, accuracy, and accuracy by risk grade in the chat.